Goal
By the end of this tutorial, you will be able to launch the Graph and Values widgets, adjust time ranges, compare data between sites, and export readings to CSV.
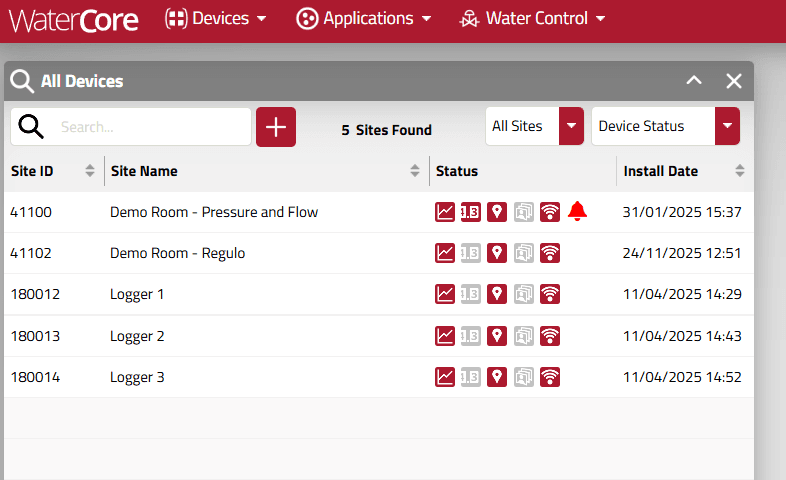
Beyond the List
Start hereWhile the All Devices list provides a quick status overview, the Graph and Values tools allow you to perform deep-dive analysis on your network's performance. These tools help you identify trends, spot anomalies, and verify that your assets are operating within expected parameters.
Launching the Data Viewer
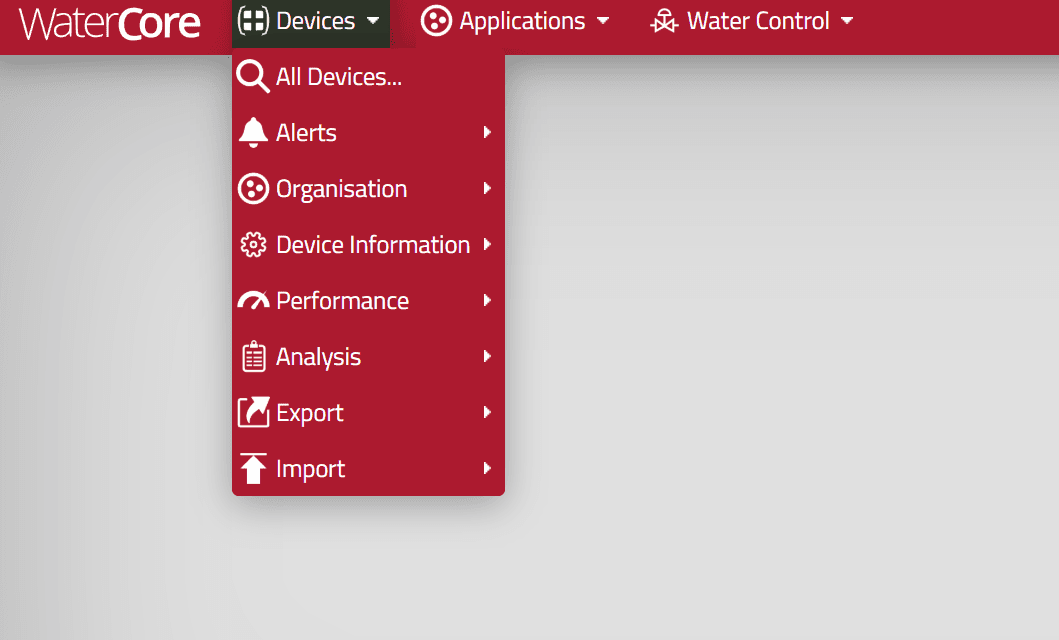
From the All Devices list, you can open data for any specific site using the action icons found in each site row:
- Graph Icon: Opens the site's recorded data-streams in a visual timeline.
- Values Icon: Displays the same data in a precise, tabular format.
opening-graphs.mp4
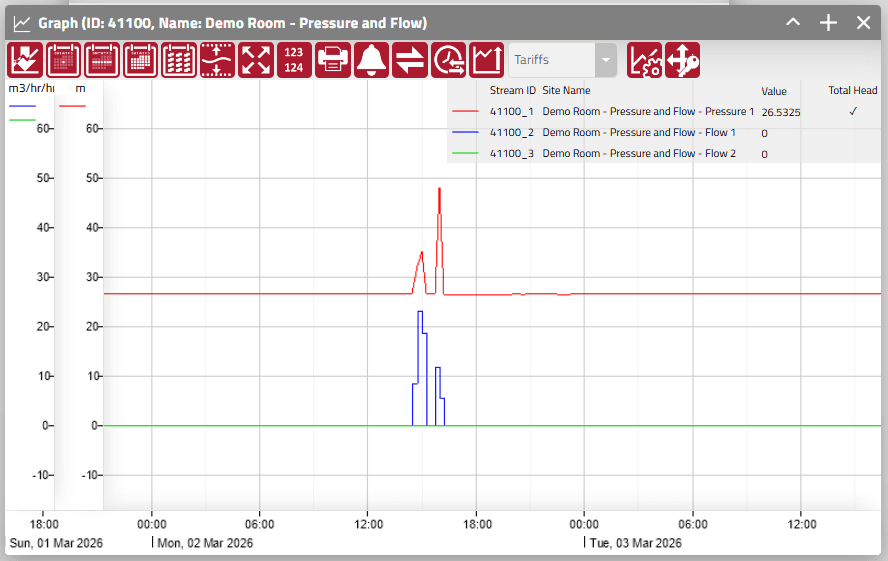
Open video in new tabNavigating the Graph
The Graph widget provides several ways to interrogate your data over time:
- Time Range Shortcuts: Quickly zoom to the last 24 hours, 7 days, 1 month, or 1 year using the zoom buttons in the top toolbar.
- Interactive Navigation: Use your mouse scroll wheel to zoom in and out, or click and drag a rectangular area to zoom into a specific event.
- Averaging: Use the Average drop-down menu to simplify complex graphs by showing hourly, daily, or weekly mean values.
To view precise readings, hover your cursor over any part of the trend line; the Graph Key will update to show the exact value at that specific timestamp.
zooming-graphs.mp4
Open video in new tab